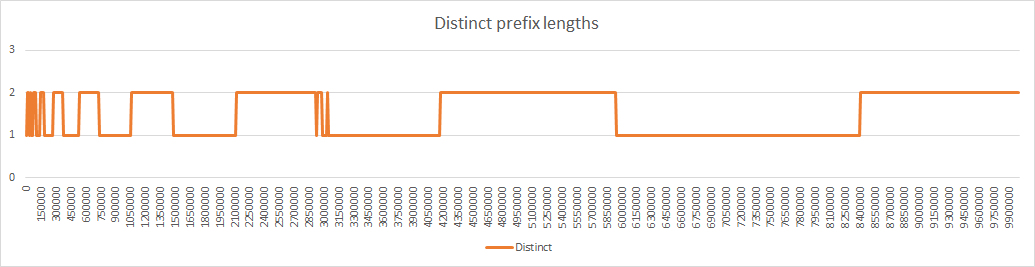
I have been thinking about sections with distinct prefix lengths: What is the problem when there are 3 distinct values?
The simple answer is that a section with the shorter prefix manages an XOR range 4 times larger than another one with the longer prefix. This means it will store 4 more times data on average.
But the complete answer is more complex because the shorter prefix section is possibly issued from a merge (meaning it has more vaults to manage the larger range), whereas the longer one can be issued from a split (meaning it has less vaults but manages a smaller range).
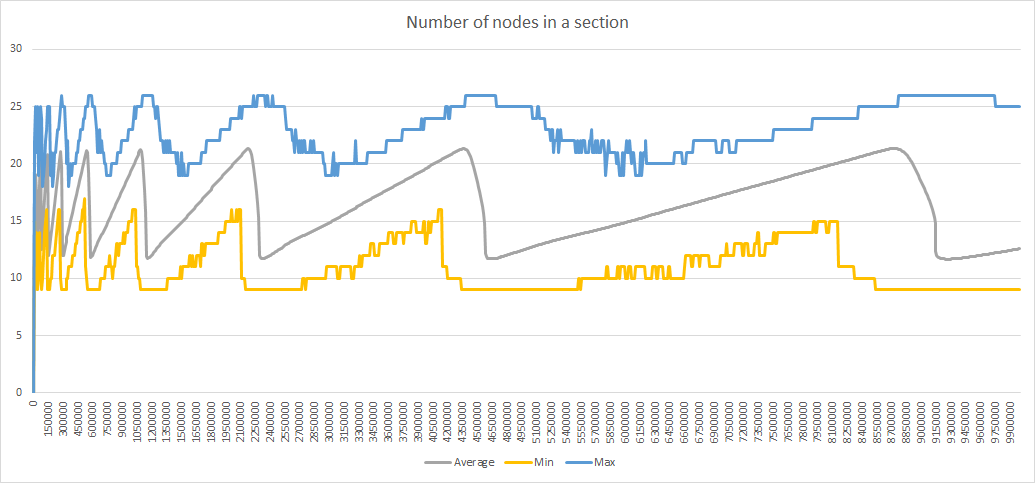
So, the important metric is not the prefix length range alone and the number of vaults in the sections must be incorporated to it.
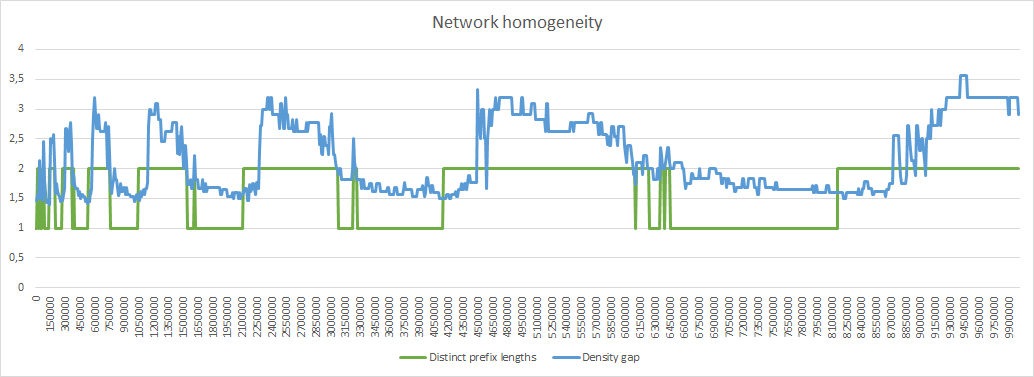
For this purpose I have added a new metric called “density gap” which is the ratio of highest section density over lowest section density where density is:
number of vaults in the section / section size.
and section size is defined in following table (where Lmax is the greatest prefix lengths):
| Prefix length |
Section size |
| Lmax |
1 |
| Lmax-1 |
2 |
| Lmax-2 |
4 |
| … |
… |
| Lmax-n |
2^n |
When there is only one prefix length, the density gap is simply the vault count of the most populated section divided by the vault count of the least populated one. When there are several distinct prefix lengths the section size divisor takes into account the relative size of the section in the XOR space.
The density gap is a number greater than 1 and the lower the value is, the more homogeneous the network is.
Its range is similar to the number of distinct prefix lengths and so the 2 curves can be displayed in the same chart, with the same ordinate scale.
I have also added a new parameter (relocation_margin) to control more precisely inhibition of relocations from a small section. Last week, the formula I came up with was: adult count <= GROUP_SIZE + 1. I have changed it to: adult count <= GROUP_SIZE + relocation_margin, which defines the following behaviors:
-
relocation_margin=-1: no inhibition, this is the original behavior from @bart’s code
-
relocation_margin=0: relocation is inhibited if it would trigger a section merge
-
relocation_margin=1: relocation is inhibited if a subsequent node drop would trigger a section merge (same behavior as last week version)
-
relocation_margin=2: relocation is inhibited if 2 subsequent node drops would trigger a section merge
-
…
I have launched many simulations, all with 10_000_000 iterations, but with various values for the parameters. Here are the results for the 2 main metrics:
| Log File |
Nodes |
Max Gap |
| raggressivei4y4m0d100.txt |
6536206 |
4.27 |
| raggressivei4y4m0d80.txt |
6537338 |
4.53 |
| raggressivei4y4m1d100.txt |
6595668 |
4.25 |
| raggressivei4y4m1d80.txt |
6583353 |
3.56 |
| raggressivei4y4m2d100.txt |
6327650 |
3.40 |
| raggressivei4y4m2d80.txt |
6308415 |
3.20 |
| raggressivei4y4m3d100.txt |
1911206 |
4.25 |
| raggressivei4y4m3d80.txt |
953994 |
5.07 |
| rstandardi4y4m1d100.txt |
3047053 |
3.20 |
| rstandardi4y4m1d80.txt |
3043159 |
3.08 |
| rstandardi4y2m1d100.txt |
2646656 |
3.00 |
| rstandardi4y2m1d80.txt |
2639692 |
3.00 |
| raggressivei4y4m1d60.txt |
6583749 |
3.78 |
| raggressivei4y4m2d60.txt |
6292031 |
3.20 |
In all cases max gap is greater than 3, which means that sometimes there are nodes that manage an area in XOR space at least 3 times greater than some other nodes. Dispersion of max gap is very narrow so we can favor final number of nodes.
A good compromise seems to be raggressivei4y4m1d80 which corresponds to the following parameters:
init_age: 4, split_strategy: Complete, max_young: 4, iterations: 10000000, summary_intervals: 10000, growth: (90, 7), structure_output_file: None, drop_dist: Exponential, relocation_rate: Aggressive, distant_relocation_probability: 0.8, relocation_margin: 1
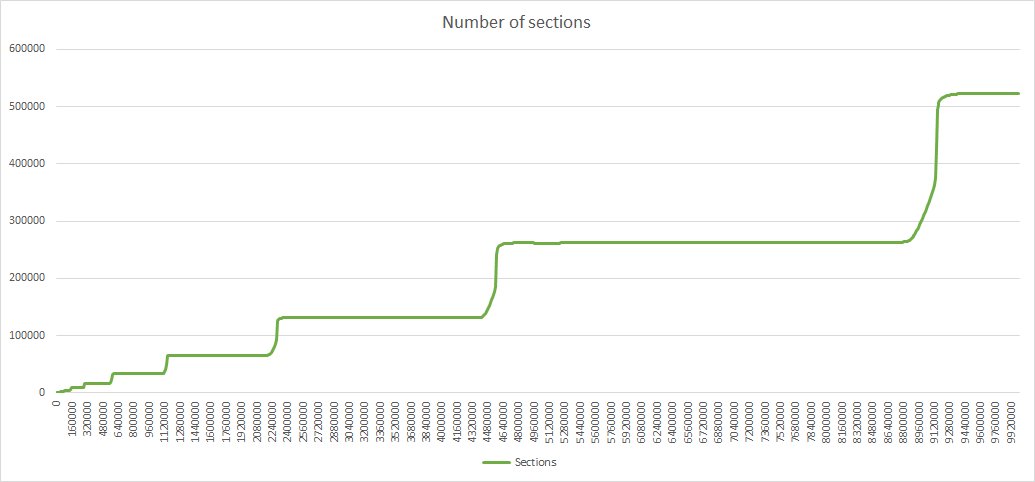
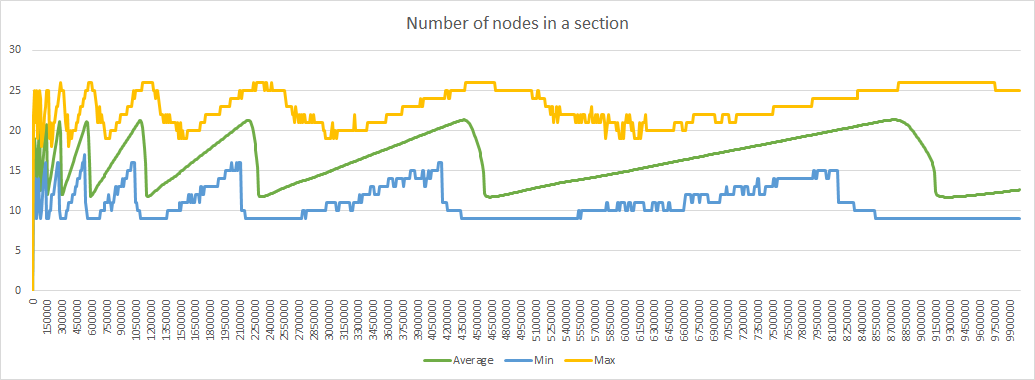
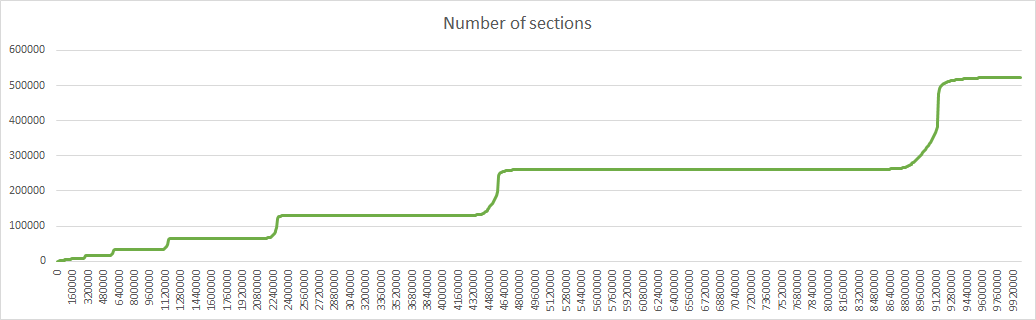
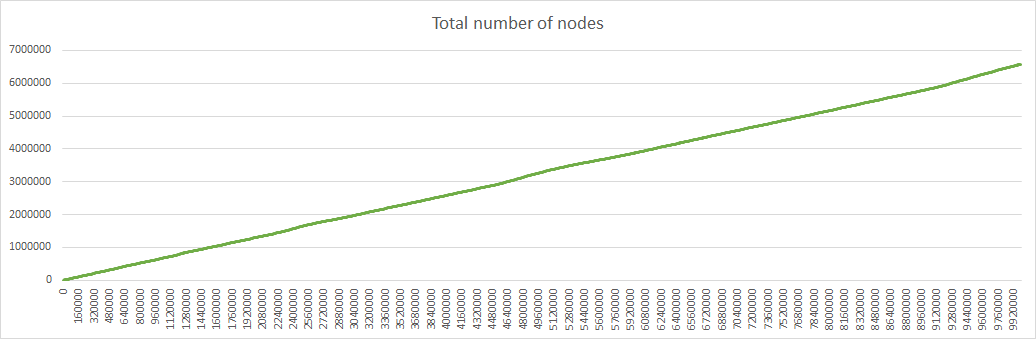
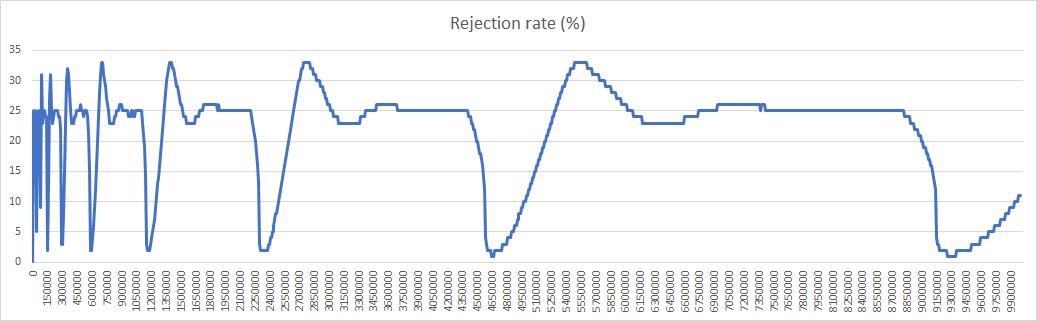
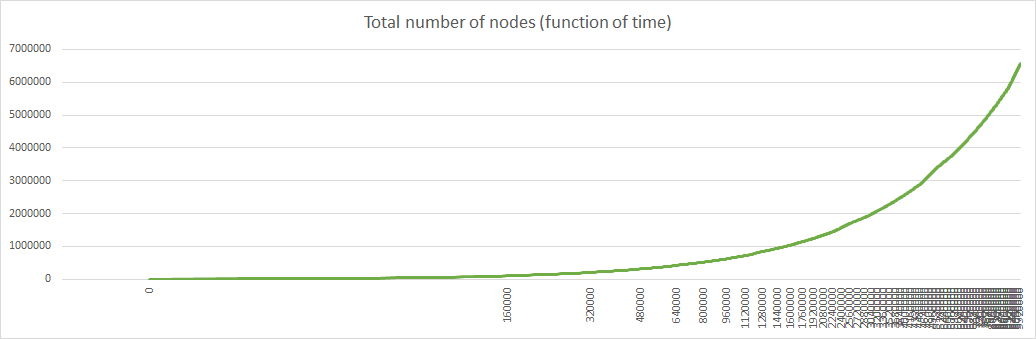
Here are the corresponding diagrams:
As I said in my previous post, time is not linear, but is more and more streched as the number of iterations grows, so the horizontal axis should be modified with a logarithmic scale if we want to show results in function of time instead of iterations. For example the strait line representing the total number of nodes is replaced by an exponential curve. Of course this is true only while the number of node creation is proportional to the network size, which cannot hold indefinitely.
Strangely, Excel doesn’t allow selection of logarithmic scale on x axis of a line chart. The workaround to get the chart was the following:
-
transform the line chart to a XY (scatter) chart
-
select logarithmic scale on x axis
-
transform the chart back to a line chart
I have created a github repo that contains all my log files and Excel files. The Excel files were manually edited, but a simple utility (extract.sh) allows extraction of columns from the log files.
This will conclude my tests on simulations. The parameters I have selected (-raggressive -i4 -y4 -m1 -d80) favor network growth by keeping rejection rate largely under 33%. Density gap is a bit high (3.56) but anyway it cannot go under 3. A 80% distant relocations percentage is secure enough, lowers density gap from 4.25 to 3.56 and has minimal impact on the final number of nodes (6583353 instead of 6595668).