Need help understanding an error thrown from safe_app.dll

Hey all,

I have been stuck for a while, trying to solve this on my own, but I cannot locate the actual cause for the error, and I hope that maybe the details of it might give someone a clue as to what might be going on, so that I can get some new angle and approach the problem again.

I like to consider myself a super problem solver guy in managed land. The problems can always be found and fixed eventually. But when it comes to unmanaged code, well that’s simply not something I’ve been doing, and it’s completely veiled to me for this reason. So, it’s hard for me to tell what this is about.

Now, since this is not an error I’ve seen anyone mention, I assume it is some implementation error on my side. However, I can’t find anything substantial to support it.
I am running out of ideas and the single substantial clue I have is pointing towards safe_app.dll.
The problem occurs both on alpha-2 and on local network, no difference discerned (other than latency ofc).

- What application or program are you running?
SAFEExamples.Notebook, referencing dlls from SAFE.EventStore and SAFE.DotNet (which is a C# wrapper around safe_app.dll based on SafeMessages example app).
I compiled safe_app and system_uri from alpha_2 branch.
SAFE.DotNet.Auth also based on SafeMessages example app, is included in the Notebook example app.

- What’s the version number?
N/A

- What are the version numbers of the supporting dependencies that you are using locally? For example, Node.js, NPM, and Rust.
VS2017 Community, dot net core 2.0

- Which operating system are you using and which version number?

Windows 10 Education in a Hyper-V VM (Microsoft Windows NT 6.2.9200.0)

- What steps did you follow when the error occurred and how can we reproduce it?

So, when debugging, and performing a repeatable set of operations, I get a crash. Sometimes there’s an indication from debugger that the error comes from unmanaged code.
Since I have turned on catching of all possible exceptions, it seems likely (I nearly never see this when not dealing with unmanaged code, exceptions are almost always caught).

In EventViewer I have information like this:

Fault bucket 1292424819593853224, type 4
Event Name: APPCRASH
Response: Not available
Cab Id: 0

Problem signature:
P1: dotnet.exe
P2: 2.0.25816.2
P3: 59e535ea
P4: StackHash_afc1
P5: 0.0.0.0
P6: 00000000
P7: c0000005
P8: PCH_D3_FROM_**safe_app**+0x000000000008C363
P9: 
P10: 

The crash is very predictable, but more with the writes than the reads. When I run around 8 (x2) write operations in a row it crashes. It takes more read operations.

The writes operations look like this:
First creating an MD with a couple of entries, and an IMD, then inserting to the MD + 1 new IMD per iteration.
The reads just fetches this data.

All of this, just to clarify, is same on local network as well as alpha-2 network.

I did a series of tests to try find a pattern:
(For the time being you can ignore InvalidHashName error, since it has something to do with the local network, and is not relevant for this problem. Although it is also a problem I would like solved, but I’m trying to dilute my addition to support-requests here as much as possible, so another time :slight_smile: )

Results of iterations of GETs
  • 34 gets then dotnet crash
  • InvalidNameHash (5 s later)
  • 34 gets then UnhandledException (NullReferenceException) with no stack trace (Your app has entered a break state, but no code is currently executing that is supported by the selected debug engine (e.g. only native runtime code is executing).)
    Thread being at [Managed to Native Transition] (5 s later)
  • InvalidNameHash (~ 2 min later)
  • InvalidNameHash (5 s later)
  • InvalidNameHash (5 s later)
  • InvalidNameHash (5 s later)
  • InvalidNameHash (5 s later)
  • 145 gets then dotnet crash (5 s later)
  • 32 gets then dotnet crash (45 s later)
  • InvalidNameHash (10 s later)
  • InvalidNameHash (5 s later)
  • InvalidNameHash (5 s later)
  • 102 gets then then UnhandledException (NullReferenceException) with no stack trace (5 s later)
  • 65 gets then dotnet crash (45 s later)
  • InvalidNameHash (5 s later)
  • InvalidNameHash (5 s later)
  • 30 gets then dotnet crash (10 s later)
  • InvalidNameHash (5 s later)
  • InvalidNameHash (5 s later)
  • InvalidNameHash (5 s later)
  • 29 gets then then UnhandledException (NullReferenceException) with no stack trace (5 s later)
  • InvalidNameHash (15 s later)
  • InvalidNameHash (5 s later)
  • InvalidNameHash (5 s later)
  • InvalidNameHash (5 s later)
  • InvalidNameHash (5 s later)
  • InvalidNameHash (5 s later)
  • InvalidNameHash (5 s later)
  • InvalidNameHash (5 s later)
  • InvalidNameHash (5 s later)
  • InvalidNameHash (5 s later)
  • InvalidNameHash (5 s later)
  • InvalidNameHash (5 s later)
  • InvalidNameHash (5 s later)
  • InvalidNameHash (45 s later)
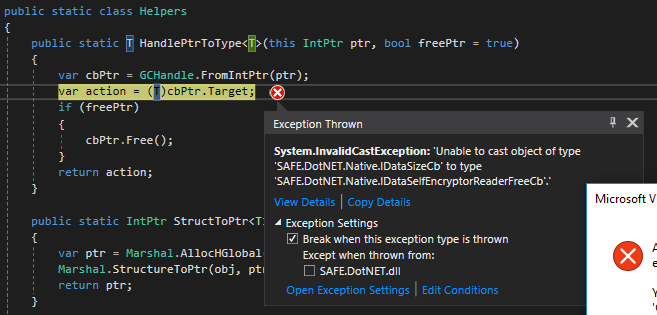
  • 60 gets then (Your app has entered a break state, but no code is currently executing that is supported by the selected debug engine.) One thread at IDataSelfEncryptorReaderFreeNative (10 s later)
  • 59 gets then dotnet crash (45 s later)
  • InvalidNameHash (15 s later)
  • InvalidNameHash (5 s later)
  • 25 gets then dotnet crash (5 min later)
  • InvalidNameHash (5 s later)
  • 27 gets then dotnet crash (5 s later)
  • InvalidNameHash (15 s later)
  • InvalidNameHash (5 s later)
  • InvalidNameHash (5 s later)
  • InvalidNameHash (5 s later)
  • InvalidNameHash (5 s later)
  • InvalidNameHash (5 s later)
  • InvalidNameHash (5 s later)
  • InvalidNameHash (5 s later)
  • InvalidNameHash (5 s later)
  • InvalidNameHash (5 s later)
  • InvalidNameHash (5 s later)
  • InvalidNameHash (5 s later)
  • InvalidNameHash (5 s later)
  • InvalidNameHash (5 s later)
  • InvalidNameHash (5 s later)
  • InvalidNameHash (5 s later)
  • InvalidNameHash (5 s later)
  • 26 gets then dotnet crash (5 s later)
  • InvalidNameHash (15 s later)
  • InvalidNameHash (5 s later)
  • InvalidNameHash (5 s later)
  • InvalidNameHash (5 s later)
  • InvalidNameHash (5 s later)
  • InvalidNameHash (5 s later)
  • InvalidNameHash (5 s later)
  • InvalidNameHash (5 s later)
  • InvalidNameHash (5 s later)
  • 55 gets then dotnet crash (15 s later)

The info from the debugger, and the fact that I cannot actually catch the exceptions, all suggest that it stems from the unmanaged code, and this is all supported by the error event in EventViewer.

Doesn’t matter if I iterate with no delay or put in ~1 minut delay between iterations.
However, doing a few, then waiting 5-10 minutes or so, will allow a bit more than expected, but then it inevitably crashes anyway.

Ok so, just throwing this out there, hoping that maybe someone has a Eureka moment. :slight_smile:

1 Like

@bochaco I was thinking that he should be able to put a log.toml in the same directory as safe_app.dll to log the native libs. Is that correct?

@oetyng You can obtain a log.toml from the releases here. I suppose then that it should be placed in the same directory as whatever is calling your library which depends on safe_app.dll.

Just my initial thought while I continue to understand and think about the problem.

cc: @nbaksalyar

3 Likes

You actually need the log.toml file to be at the same location as where the app’s executable is, regardless of where the safe_app.dll is located.

2 Likes

Just a couple of questions to try understanding it better:

By a local network you mean safe_vault instances that you run on your local machine, right?
Have you tried it with mock-routing build of safe_app, does the problem still persist?

And the issue can be reproduced by running the example repo that you’ve linked (SAFEExamples.Notebook), correct?

2 Likes

Thanks alot @hunterlester, @bochaco and @nbaksalyar for picking it up so fast!

Yes, that’s right, by running safe_vault instances on my local machine. I followed the instructions here: How to run a local test network - #6 by Mindphreaker

I did not try it with mock-routing build of safe_app yet though. I guess that would be a good way to exclude some possible causes.

That’s correct.

EDIT: in SAFEExamples.Notebook, you need to reference SAFE.EventStore which in turn uses SAFE.DotNet.
So these two repos should be cloned, and then you could either include the referenced projects into the Notebook solution, or build them and reference the output dlls.

2 Likes

I have been away for a week.
The log.toml only says this:

[appenders.async_console]
kind = "async_console"
pattern = "{({l}):1.1} {d(%y-%m-%d %H:%M:%S%.6f)} [{M} #FS#{f}#FE#:{L}] {m}\n"

[[appenders.async_console.filters]]
kind = "threshold"
level = "trace"

[appenders.async_file]
kind = "async_file"
output_file_name = "Client.log"
pattern = "{({l}):1.1} {d(%y-%m-%d %H:%M:%S%.6f)} [{M} #FS#{f}#FE#:{L}] {m}\n"
append = false
file_timestamp = true

[root]
level = "error"
appenders = ["async_console", "async_file"]

[loggers."crust"]
level = "debug"

[loggers."routing"]
level = "trace"

[loggers."routing_stats"]
level = "trace"

[loggers."safe_core"]
level = "trace"

[loggers."safe_app"]
level = "trace"

[loggers."safe_authenticator"]
level = "trace"

[loggers."ffi_utils"]
level = "trace"
1 Like

Place log.toml in your directory containing program that indirectly executes the native libraries.

For example, in SAFE Browser, there’s a log.toml in the same directory as the application executable.
See:
browser_files

Log output file being there as well: C:\Users\guilf\Desktop\safe-browser-mock-v0.8.1-win-x64\safe-browser-mock-v0.8.1-win-x64\SAFE_App_Browser_Plugin.MaidSafe.net_Ltd.log.

1 Like

Something is not right, because I don’t get anything else than what I pasted above.
I placed it both in the debug folder (where all files are copied to before executing them), and it already existed in two other places: main folder of solution, and Documents where FileOps.cs, class copied from SafeMessages, places it.

I can see though that I have this:

NativeBindings.AppInitLogging(null, cb2);

and first parameter name is actually fileName, so I wonder if it really should be null…

On the other hand, this is also called:

NativeBindings.AppSetAdditionalSearchPath(fileOps.ConfigFilesPath, cb1);
… and this is the path to which the log.toml is copied in FileOps.cs.

Not sure what can be wrong here.

1 Like

oh wait… I had commented out InitLogging… however logs were written to console but not file
Amazingly though, I was able to go way past the 8x2 writes that has been an almost 100% sure block (the crash in OP ocurred here)! But I actually got to 17x2 writes!

And additionally I was able to catch an InvalidCastException!
invalidcastexception

This was an interesting turn of events… OK, I will be trying some more here.

EDIT:

OK, so… I’ll rewind a bit.

I actually had a memory leak when implementing the reading from Immutable data, based on the documentation here: http://docs.maidsafe.net/beaker-plugin-safe-app/#windowsafeimmutabledataread

So I added

await IData.SelfEncryptorReaderFreeAsync(seReaderHandle);

which probably goes without saying that it should be there…

Anyway, this is where the exception above happened.
And the entire method looks like this:

async Task<EventData> GetEventDataFromAddress(StoredEvent stored)
        {
            var seReaderHandle = await IData.FetchSelfEncryptorAsync(stored.DataMapAddress);
            var len = await IData.SizeAsync(seReaderHandle);
            var readData = await IData.ReadFromSelfEncryptorAsync(seReaderHandle, 0, len);
            
            var eventData = new EventData(readData.ToArray(),
                stored.MetaData.CorrelationId,
                stored.MetaData.CausationId,
                stored.MetaData.EventClrType,
                stored.MetaData.Id,
                stored.MetaData.Name,
                stored.MetaData.SequenceNumber,
                stored.MetaData.TimeStamp);

            await IData.SelfEncryptorReaderFreeAsync(seReaderHandle);

            return eventData;
        }

I just want to point out though, that I suspect (without being sure of course) that this is not the same problem as the OP is describing. But for the sake of the full picture I’m adding it here anyway.

EDIT2:
So, I got to 17x2 writes again, with exactly the same exception. Now just battling the connection to the local network so that I can try it out some more times… brb.

EDIT3:

Ok, so… Having 2 libs (SAFE.DotNet and SAFE.DotNet.Auth) initiating logging and copying to same location via FileOps was causing problems with concurrent access to the file, that’s why I had it commented out in SAFE.DotNet. However, I could not connect to local network when not initiating logging in the Auth project… I don’t understand the correlation here and it seems strange to me that the logging would impact connectivity.
So I just let these two projects copy their log.toml to separate directories.

And now I could connect, and confirm that it is exactly the same amount of writes that gives this InvalidCastException every time (17x2).
Good news is that this hardly traceable dotnet crash OP is about, has not occurred after turning on the logging (again,. strange correlation…?).

I have the logs from the console now, about 950 000 loc more than allowed to post here though. How shall I send it over?

EDIT4:
There it came again though… the crash described in OP. After 8x2 writes. So, it seems to still be a problem.

With regards to IDataSelfEncryptorReaderFreeNative error:
I noticed that after 16x2 writes, this part of the code:

 IDataSelfEncryptorReaderFreeCb callback = (_, result) => {
                if (result.ErrorCode != 0)
                {
                    tcs.SetException(result.ToException());
                    return;
                }

                tcs.SetResult(null);
            };

has errorcode -1010, Invalid Self Encryptor handle

But trying to get there again I am now always getting error after 8x2 writes. So I seem to be back on square one again.

EDIT5:

Ok, I have found a pattern…
When I create multiple streams in same db, the OP error seems to show.

When creating new db, I seem to be able to get past that error, and instead I get
Invalid Self Encryptor handle after about 9x2 writes, and never beyond 17x2 writes.

Huh… OK. picture is getting clearer. I am beginning to suspect some MD size problem maybe. It shouldn’t be though…

EDIT6:
My theory didn’t hold. I thought that within same db, I could only create maybe 2-3 streams with 17x2 writes, and after that all new streams would make the app crash after 8x2 writes.
In this trial I got the expected crash after 4th stream, but then I could do 17x2 writes again on the 5th stream, and 20x2 on the 10th stream.

Results: in one and the same db, before getting the InvalidCastException
Unable to cast object of type 'SAFE.DotNET.Native.IDataFetchSelfEncryptorCb' to type 'SAFE.DotNET.Native.IDataSelfEncryptorReaderFreeCb'.

1st stream 17x2 writes, InvalidCastException
2nd stream 17x2 writes, InvalidCastException
3rd stream 22x2 writes, InvalidCastException

then on 4th stream, I can only do 9x2 writes, before getting the crash without any exception caught.

5th, 21x2 writes InvalidCastException
6th, 9x2 writes crash without any exception caught.
7th, 9x2 writes crash without any exception caught.
8th, 8x2 writes, InvalidCastException
9th, 8x2 writes crash without any exception caught.
10th, after 15x2 writes: a whole lot of D 18-01-27 19:18:39.319942 [safe_app::ffi::immutable_data immutable_data.rs:365] **ERRNO: -1010** InvalidSelfEncryptorHandle
then after total 20x2 writes, the InvalidCastException

This all seems semi-nondeterministic, making it hard to find a pattern which would indicate what is going wrong.

1 Like

I created a new topic for the self encryptor callback cast issue, as to try to keep efforts and attention on solving the problem of OP. (I am btw still not closer to knowing what is going on there.)

Okay, this whole thing needs a new approach, this is getting nowhere.

I started with the first write operation that is made: create a db.

Iterations with 100 ms delay, after 51 iterations (always same count) AppSession destructor is called (do not know why yet), whereby Session.AppPtr is set to IntPtr.Zero, which is setup to cause exception be thrown on subsequent access to this property. Meanwhile, in a parallel thread, a NativeHandle somewhere is being disposed, and when calling native code to free it, there is an access to Session.AppPtr. Boom…

To be continued. I suspect I will find quite a few things with this approach, before getting to the real problem of OP.

(This is more or less the example code - copy paste from SafeMessages app - only being tested now, or equivalent flow)

Questions so far:

  1. What is it that happens after 51 iterations of creating 2 MDs with write permissions inserted?
  2. Is there a general design flaw that we can reset Session.AppPtr, before all current usage of it has ended?

Answers so far:

  1. I have no idea.
  2. I suspect so, and will try to redesign it.

Here follows some results, one section per operation type, with some input variations for each session.

Create db iteration results

Delay: 100 ms
Iterations: 51
Event: AppSession destructor is called, thereby resetting Session.AppPtr before last use of it, causing ArgumentNullException thrown on a subsequent NativeHandle destructor called.

Delay: 200 ms, 1 000 ms,
Iterations: 51
Event: Crash, with msg The program ‘[4404] dotnet.exe’ has exited with code -1073741819 (0xc0000005) ‘Access violation’.

Delay: 5 000 ms,
Iterations: 51
Event: An unhandled exception of type ‘System.NullReferenceException’ occurred in Unknown Module. Object reference not set to an instance of an object.
(No stacktrace, ie. suspected origin: native code. Same as observed when running SAFEExamples.NoteBook after 17x2 or so writes!)

Delay: 10 000 ms
Iterations: 51
Event: AppSession destructor is called, thereby resetting Session.AppPtr before last use of it, causing ArgumentNullException thrown on a subsequent NativeHandle destructor called.

Thoughts:
Progress! Already at this early (relatively, from my high abstraction point of view) stage of code depth (a lot more isolated than running all layers of abstraction) we are seeing similar problems!
Increased delay between iterations does not ameliorate the problem of errors showing up, but it does affect which kind of error we see… Which is not making sense to me currently. But I guess my initial theory of some corrupt memory somewhere is still a good candidate considering these seemingly uncorrelated and dispersed error types.

EDIT:
Regarding question #2
This is just a very small detail of higher level implementation. Temporary solution:
I did a static reference to the AppPtr that is not reset when AppSession destructor is called.
Probably not especially important, but if we want to be able to free all currently used NativeHandles, even after an AppSession has been disposed, then it needs some other approach. So, that would be something to think about for people using the code (or more probable: other examples not yet produced) for reference later.

So, when removing that noise, I’m back at unexplicable app crash. Debugging session just ends and in EventViewer all we can see is that dotnet.exe crashed.

Back to the OP question:
Now, I’m getting closer to a question that is maybe possible to answer for someone out there.

I have boiled it down to a very limited set of operations
    // Creates db with address to category MD
    public async Task CreateDbAsync(string databaseId)
    {
        databaseId = DbIdForProtocol(databaseId);

        if (databaseId.Contains(".") || databaseId.Contains("@"))
            throw new NotSupportedException("Unsupported characters '.' and '@'.");

        // Check if account exits first and return error
        var dstPubIdDigest = await GetMdXorName(databaseId);
        using (var dstPubIdMDataInfoH = await MDataInfo.NewPublicAsync(dstPubIdDigest, 15001))
        {
            var accountExists = false;
            try
            {
                var keysH = await MData.ListKeysAsync(dstPubIdMDataInfoH);
                keysH.Dispose();
                accountExists = true;
            }
            catch (Exception)
            {
                // ignored - acct not found
            }
            if (accountExists)
            {
                throw new Exception("Id already exists.");
            }
        }

        // Create Self Permissions
        using (var categorySelfPermSetH = await MDataPermissionSet.NewAsync())
        {
            await Task.WhenAll(
                MDataPermissionSet.AllowAsync(categorySelfPermSetH, MDataAction.kInsert),
                MDataPermissionSet.AllowAsync(categorySelfPermSetH, MDataAction.kUpdate),
                MDataPermissionSet.AllowAsync(categorySelfPermSetH, MDataAction.kDelete),
                MDataPermissionSet.AllowAsync(categorySelfPermSetH, MDataAction.kManagePermissions));

            using (var streamTypesPermH = await MDataPermissions.NewAsync())
            {
                using (var appSignPkH = await Crypto.AppPubSignKeyAsync())
                {
                    await MDataPermissions.InsertAsync(streamTypesPermH, appSignPkH, categorySelfPermSetH);
                }

                // Create Md for holding categories
                var categoriesMDataInfoH = await MDataInfo.RandomPrivateAsync(15001);
                await MData.PutAsync(categoriesMDataInfoH, streamTypesPermH, NativeHandle.Zero);

                var serializedCategoriesMdInfo = await MDataInfo.SerialiseAsync(categoriesMDataInfoH);

                // Finally update App Container (store db info to it)
                var database = new Database
                {
                    DbId = databaseId,
                    Categories = new DataArray { Type = "Buffer", Data = serializedCategoriesMdInfo }, // Points to Md holding stream types                                                                                    
                };

                var serializedDb = JsonConvert.SerializeObject(database);
                using (var appContH = await AccessContainer.GetMDataInfoAsync(AppContainerPath)) // appContainerHandle
                {
                    var dbIdCipherBytes = await MDataInfo.EncryptEntryKeyAsync(appContH, database.DbId.ToUtfBytes());
                    var dbCipherBytes = await MDataInfo.EncryptEntryValueAsync(appContH, serializedDb.ToUtfBytes());
                    using (var appContEntryActionsH = await MDataEntryActions.NewAsync())
                    {
                        await MDataEntryActions.InsertAsync(appContEntryActionsH, dbIdCipherBytes, dbCipherBytes);
                        await MData.MutateEntriesAsync(appContH, appContEntryActionsH);
                    }
                }
            }
        }
    }

This is very similar to the SafeMessages example MaidSafe have here: https://github.com/maidsafe/safe_mobile

Iterating 51 times over the above code will make the app crash with no signs of why (that I could find).

Below, I will start with the first interactions with safe_app.dll, and see how many iterations I can go before breakdown. Then I will add another interaction, and see how many iterations we can go before errors, until we have added all interactions with safe_app.dll that we see in the code block above.
By doing this I would like to find the place where something goes wrong, and if not that: get more clues.

Each set of iteration is ending with some of following errors (not deterministic which error shows up for which operations):

  • AppSession destructor is called for some unknown reason. No logs in EventViewer.
  • NullReferenceException occurred in Unknown Module, without stacktrace. No logs in EventViewer.
  • ExecutionEngineException occurred in Unknown Module, without stacktrace. No logs in EventViewer.
  • Crashes in the same unexplicable way as described in OP. Errror message The program '[16784] dotnet.exe' has exited with code -1073741819 (0xc0000005) 'Access violation'. and with
following logs in EventViewer:
Fault bucket 2253332025786264427, type 5
Event Name: BEX64
Response: Not available
Cab Id: 0

Problem signature:
P1: dotnet.exe
P2: 2.0.26021.1
P3: 5a3b026e
P4: StackHash_03ab
P5: 0.0.0.0
P6: 00000000
P7: PCH_B2_FROM_safe_app+0x0000000000584D45
P8: c0000005
P9: 0000000000000008
P10:

(this sounds to me like some memory access violation in safe_app.dll)


Starting with the very first interaction:

Iterating over Sha3HashAsync
    async Task<List<byte>> GetMdXorName(string plainTextId)
    {
        return await NativeUtils.Sha3HashAsync(plainTextId.ToUtfBytes());
    }

Is unproblematic for ~1285 iterations, with 1 ms delay.

Next, add: MDataInfo.NewPublicAsync
        databaseId = DbIdForProtocol(databaseId);

        var dstPubIdDigest = await GetMdXorName(databaseId);
        using (var dstPubIdMDataInfoH = await MDataInfo.NewPublicAsync(dstPubIdDigest, 15001))
        {
            // no action here
        }

Is unproblematic for ~ 730 iterations, with 1 ms and 100 ms delay.

Next, add: MData.ListKeysAsync
        databaseId = DbIdForProtocol(databaseId);

        var dstPubIdDigest = await GetMdXorName(databaseId);
        using (var dstPubIdMDataInfoH = await MDataInfo.NewPublicAsync(dstPubIdDigest, 15001))
        {
            var accountExists = false;
            try
            {
                var keysH = await MData.ListKeysAsync(dstPubIdMDataInfoH);
                keysH.Dispose();
                accountExists = true;
            }
            catch (Exception)
            {
                // ignored - acct not found
            }
            if (accountExists)
            {
                throw new Exception("Id already exists.");
            }
        }

Is unproblematic for ~540 iterations, with 1 ms and 100 ms delay.

Next, add: MDataPermissionSet.NewAsync
        using (var categorySelfPermSetH = await MDataPermissionSet.NewAsync())
        {
           
        }

~440 iterations

Next, add: 4 x MDataPermissionSet.AllowAsync
        using (var categorySelfPermSetH = await MDataPermissionSet.NewAsync())
        {
            await Task.WhenAll(
                MDataPermissionSet.AllowAsync(categorySelfPermSetH, MDataAction.kInsert),
                MDataPermissionSet.AllowAsync(categorySelfPermSetH, MDataAction.kUpdate),
                MDataPermissionSet.AllowAsync(categorySelfPermSetH, MDataAction.kDelete),
                MDataPermissionSet.AllowAsync(categorySelfPermSetH, MDataAction.kManagePermissions));
        }

~410 iterations

(not yet committed state to the network.)

Next, add: MDataPermissions.NewAsync
 using (var streamTypesPermH = await MDataPermissions.NewAsync())
 {
      // no action
}

~375 iterations

Next: Crypto.AppPubSignKeyAsync
 using (var streamTypesPermH = await MDataPermissions.NewAsync())
 {
      using (var appSignPkH = await Crypto.AppPubSignKeyAsync())
      {
           // no action
      }
}

~350 iterations

Next: MDataPermissions.InsertAsync
 using (var streamTypesPermH = await MDataPermissions.NewAsync())
 {
      using (var appSignPkH = await Crypto.AppPubSignKeyAsync())
      {
           await MDataPermissions.InsertAsync(streamTypesPermH, appSignPkH, categorySelfPermSetH);
      }
}

~335 iterations

and so on, for each additional interaction, ie:

#1: 1285 x Interaction_1
#2: 721 x #1 + Interaction_2
#3: 537 x #2 + Interaction_3
#4: 438 x #3 + Interaction_4
#5: 377 x #4 + Interaction_5
#6: 347 x #5 + Interaction_6
#7: 323 x #6 + Interaction_7
#8: 310 x #7 + Interaction_8
#9: 296 x #8 + Interaction_9
#10: 285 x #9 + Interaction_10
#11: 224 x #10 + Interaction_11
#12: 148 x #11 + Interaction_12
#13: 133 x #12 + Interaction_13
#14: 66 x #13 + Interaction_14
#15: 66 x #14 + Interaction_15
#16: 51 x #15 + Interaction_16
#17: 50 x #16 + Interaction_17

Memory footprint is low: ~70 MB.

Pattern is getting clear: any interaction we have with safe_app.dll, is contributing to what eventually leads to the crash. The more interactions, the sooner we crash.

And this code is almost 100% copy paste from the MaidSafe examples.
I’m getting more confident this is not some error on my part (ofc not convinced yet though).

Is anyone reading this btw?

I will try run this in .Net Framework instead of .Net Core, to rule out that part.

Currently, a few possible sources for errors I can see on my end are:

  1. Some overlooked implementation in setup of reproduction.
  2. Some subtle mistake in the copy paste of code from MaidSafe example.
  3. Some .Net Core specific error.
  4. Some problem with debugger. (does not seem to be, experience the same when running without it)
  5. Conflicts with other applications (very clean machine though, installed and running almost nothing else)
  6. Some problem with my OS/VM.

Other possible sources:

  1. The vaults running locally
  2. Order of execution of calls to native code.
  3. The native code itself.

@nbaksalyar I have updated the Notebook repo with a unit test for reproducing this. I hope it can be useful if you have time to look at it. :pray:

2 Likes

Update

I have made some sort of progress now (any change in outcome is progress currently). The surprise though, because I do not know exactly what caused them.
Considering that no code changes were made, only environment changes, it does puzzle me :roll_eyes:

So, the changes made to the machine were these:
I upgraded Windows 10 to Fall Creators Update 1709, installed new .Net Framework (4.7.1) and added a preview version of VisualStudio 2017 (running in parallel though, so not the one used in these tests), plus installed microservice framework ServiceFabric runtime on the machine + SDK and tools for VS. That’s pretty much it. (And the top two changes naturally would be the most likely to have anything to do with this. I have no clue how.)

The change in errors is that I now have this:

Error details

138 Writes
NullReference exc in Unknown Module.
No logs in EventViewer
Log txt:
Client-1518976953_138Writes_NullReference_UnknownModule

253 Writes
Debugger termination
EventViewer: APPCRASH
Problem signature:
P1: dotnet.exe
P2: 2.0.26021.1
P3: 5a3b026e
P4: StackHash_afc1
P5: 0.0.0.0
P6: 00000000
P7: c0000005
P8: PCH_A3_FROM_safe_app+0x000000000008C363
P9:
P10:
Log txt:
Client-1518977218_253Writes_DebuggerTermination_EventViewerAppCrash

20 Writes
NullReference exc in Unknown Module.
No logs in EventViewer
Log txt:
Client-1518977396_20Writes_NullReference_UnknownModule

197 Writes
NullReference exc in Unknown Module.
No logs in EventViewer
Log txt:
Client-1518977554_197Writes_NullReference_UnknownModule

79 Writes
Debugger termination
EventViewer: APPCRASH
Problem signature:
P1: dotnet.exe
P2: 2.0.26021.1
P3: 5a3b026e
P4: StackHash_afc1
P5: 0.0.0.0
P6: 00000000
P7: c0000005
P8: PCH_2E_FROM_safe_app+0x000000000008C363
P9:
P10:
Log txt:
Client-1518979091_79Writes_appcrash_from_safeappdll

To clarify: these are now a whole bunch more writes before there’s an error. Also, the most common error now is the NullReferenceException from native code. The semi-deterministic nature is gone, or kind of changed… Instead of always around 20 writes, I can easily get up to a couple of hundred writes. But then something happens. And the jolly old appcrash with some EventViewer trace saying it came from safe_app.dll is still there, from time to time.

The error message from the system is totally throwing me off, by stating “from safe_app.dll”. Even though I of course suspect this is caused by my code, as long as I can’t find the error in my code, and this is the error message, it certainly does indicate the possibility. (Do I hear any yay’s or nays?)
I have thought of the possibility that the error could have occurred in a callback, meaning it was thrown in safe_app.dll, but was due to errors in code passed into it.
So I placed try-catch block around all code in callbacks being passed into the native code, put a breakpoint in the catch block. Got nothing there. But the NullReference from native occurred.


There are some slightly better news here (even though, at this stage, I consider any change in outcome good news):

There was another error also described in this topic, about a higher level class being disposed for some reason. I found out it was actually the GC, and I think this bit me because I’m not used to such extensive use of static references. It’s possible that they are motivated in the EmailApp example, and also as guideline for other apps*, but generally a dependency injection pattern is considered better. I refactored all apps to instantiate classes and inject them in the higher level classes. The code base needed some love in general, so that was a good move. Also, working with the patterns you are used to makes it easier to avoid mistakes.

*For example, it might not be possible to concurrently handle apps with different logins on the same SAFENetwork client, and using static references would impose a natural limit (within the same app at least…), while dependency injection now lets me spin up n sessions and login c accounts using a apps.
This info (limitations/possibilities of client usage) is something to add to the list of stuff that could go into documentation.

So, I have been able to loop through hundreds of iterations of all 17 steps in creating a new EventStore db, actually near 1000 iterations, until my app container MD was filled to its limit with entries. This is absolutely great, because before this I could not break the 51 iteration limit at all. (But yeah, this was just a stupid simple error in managing references on a higher level, GC came and cleaned it up and boom at next access.)

There has been a couple of **ERRNO: -103** CoreError(No such data - CoreError::RoutingClientError -> NoSuchData), so still something not done properly. But that would be the topic of another post, if needed.

Hi @oetyng, we were considering to investigate this error as well by trying to reproduce it with our safe-app-nodejs package, can you please summarise/confirm what’s the scenario you are exercising here, is it just iterating and inserting into a MD until it’s fully filled up?

1 Like

Hi @bochaco,
That’s great news!

More or less correct.

I have been doing two different things, which has caused problems:

1. Creating a db, and entering new events to it.
2. Going through each step in creating a db.

And results were different after some environmental changes described in the last update.
Additionally I found a mistake on my part, which fixed one (but then I discovered one new problem).


1. Inserting events into the db
There are 17 steps of interactions with SAFENetwork included in creating a db according to the protocol I set up.

After that, entering a new value to it, means creating a new immutable data, and adding a serialized object to an MD, with the datamap of the immutable data, as well as some metadata.

The error(s) here were semi-deterministic with most number of iterations before an error was around 20. But it could be 8, it could be 30 even a rare 50 or so.

After the environment changes, something seems to have changed.
So instead of mostly around 20 insertions, I could do several hundreds. But then I hit the same errors. (Although more NullReferenceExceptions from native code than before).

2. Creating the db
So what I did here was to iterate through the very first step of creating a db, until I hit the error.
Then I did the same with step 1 + 2, then step 1 + 2 + 3, and so on. Until I iterated over all 17 steps (i.e. sha3, newpublic, permissions etc. etc., committing the changes and so on).
Only doing the first step (sha3), brought me to an exception after about 1285 iterations.
Doing all 17 steps brought me to a halt after only 51 iterations. A predictable declining number of iterations between these. But I found out I had not used a static reference properly, so it was actually the GarbageCollector that came and swept out the rug under my feet. So that was good.

After that, (and the environmental changes), I basically didn’t hit any error before the app container MD was full with dbs (each db got its own entry in the MD). But there were a couple of the ERRNO: -103. That was a critical error that made things crash. So I still had some problems.


I think the UnitTest project in https://github.com/oetyng/SAFEExamples.Notebook will clarify this explanation even further.
1. Was done by just running the Notebook console app.
2. Was done by running the UnitTest.

And please ask more if you need! :slight_smile:

1 Like

Thanks @oetyng, I’ll try to create a nodejs script to try to reproduce the scenario you are describing, and I’ll share it here for your review, from your description, we may have to do it incrementally trying to complete the whole flow you describe. I took a look at the test project so I will follow it at a very high level to try to create the set of steps and then perhaps you can help me to fill in any missing details. I’ll get back with the first draft in the next few days.

1 Like

Hi @oetyng, I took a look at this more closely, and I noticed something that could explain what the errors you are seeing are coming from, i.e. ERRNO: -103 CoreError(No such data - CoreError::RoutingClientError -> NoSuchData).

If I understand correctly, in your write test #3 you are attempting to fetch the list of keys from a public MD you just created: https://github.com/oetyng/SAFEExamples.Notebook/blob/master/SAFE.UnitTests.BugRepro/SAFEDataWriter.cs#L97
This is expected to trigger that error as the MD was not committed to the network yet, thus the data for such a MD is not found on the network. You’ll first need to commit it with mdata_put before you can execute the mdata_list_keys function on a MD.

3 Likes

I created a branch with a test where I’m performing the exact same steps as your test suite but from a Node.js app (using @maidsafe/safe-node-app npm package v0.8.1): https://github.com/bochaco/safe_app_nodejs/blob/MAID-2577-soak-test/examples/standalone/scripts/soak_test.js

Comparing it with your test suite there are only a couple of minor differences:

  1. I’m skipping your test’s steps 4 and 5 since I’m using latest version of safe_app lib (v0.6.0), the creation of permissions set is not needed in this case as they are passed as a list when inserting them into the permissions object.
  2. Due to what I explained before in previous post, what your test does in step 3, mine does it after what would be your test’s step 10, i.e. I’m getting the list of entries keys after I committed the private MD with mdata_put.

To run my test you’ll either need to generate an auth URI yourself and replace it in L5, or you can just use the MockVault I uploaded with my branch, you can download it from here.

The uploaded MockVault file has the soak test app already authorised and it can therefore connect with the auth URI that’s already in my code. If you need to, you can also run the browser with this mock file and log in with secret and password: safenetsoaktest

In order to run the test, you’ll need to:

  1. Clone my MAID-2577-soak-test branch:
    # git clone -b MAID-2577-soak-test https://github.com/bochaco/safe_app_nodejs.git

  2. Change dir onto the examples/standalone folder of the cloned repo

  3. From there you need install dependencies with:
    # npm i

  4. And finally run the soak test with:
    # npm run soak_test ['number of iterations (default: 400)' ['number of steps per iterations: 1 to 15 (default: 15)'] ]

E.g. to run 492 iterations with all 15 steps:
# npm run soak_test 492 15

If you run it with mock with more than 492 iterations you should get the following error since you run our of PUT credits in the mock: -113: Core error: Routing client error -> Insufficient account balance for this operation.
You can replace the mock vault file with a fresh copy when this happens to be able to run it again.

I hope this helps. I’m not having any issues with running this test with mock, I haven’t run it with my own local network yet but I will shortly do it as well and will share the outcome.

3 Likes

Hi @bochaco,

Ah, yes, that’s probably what I saw in the logs.

However, this part is expected to try fetch it on existing or non existing entry. It is a way to see if the MD already exists, and we expect it to throw an exception (which we catch and ignore) if it does not exist. (Actually, it was part of the Safe messages example and I borrowed it from there.)

But it makes sense that the error shows up in the logs regardless, didn’t realize it came from this line.

EDIT: I thought for a while this meant, that #2 is not causing anymore problems. That error was the last one I hit there (well, I didn’t realize it came from that part of the code - where it was expected - and thought something was going wrong somewhere else). But actually, it was a coincidence. Something is still happening after 400 dbs or so, but nothing in the logs indicate what.

Thanks! Super, that is really good, now we can compare with another implementation and hopefully be able to confirm or rule out something.

With the explanation of the ERRNO -103, I first thought the #2 had no more unsolved problems. But it was actually something happening there, just not related to that error code.
So it would be great if you could try that out with the local network, because I never tried this with mock, only the live network and running it locally.
Additionally, I should try this with mock, since you do not get any errors with >400 iterations. And I should get the code over to 0.6.0.

It looks like it could be the same thing as #1. When trying this out now I do get the same error messages in Windows EventViewer

i.e. this:

Event Name: APPCRASH
Response: Not available
Cab Id: 0

Problem signature:
P1: dotnet.exe
P2: 2.0.26021.1
P3: 5a3b026e
P4: StackHash_afc1
P5: 0.0.0.0
P6: 00000000
P7: c0000005
P8: PCH_34_FROM_safe_app+0x00000000000707D5
P9:
P10:

If it’s not the same in the node.js app when creating dbs, then maybe the other set of steps could be tried. I noticed I had not explained the WriteData test method, I referred to running the console app (which does the same, and leads to the same error, but you’ll have to manually enter the text string which forms the body of the NoteAdded event, i.e. more tedious than the test). My apologies.

I'll put it here for later reference:
    [TestMethod] // Debug this method to be able to see debug output etc.
    public async Task WriteData()
    {
        try
        {
            InitAuth();

            var session = new Session(new NativeBindings(), FileOps.Create());
            _app = new AppSession(session);

            var loginCount = 0;
            var keypass = "qwert";  // you need to have created this acc / pwd combo first.
            while (true) // login does not always work at first try with the local network.
            {
                if (await AutoLogin(keypass, keypass))
                    break;
                Debug.WriteLine(++loginCount);
                await Task.Delay(100);
            }

            var db = new EventStoreImDProtocol(_app.AppId, session); // this is the actual protocol code
            //var db = new SAFEDataWriter(_app.AppId, session); // this is just a duplication of code in a mock class, for testing.

            var version = -1;

            var dbId = Mock.RandomString(15);
            await db.CreateDbAsync(dbId); // here we create a random db
            
            var streamKey = $"{dbId}@{0}";

            while (true)
            {
                try
                {
                    var evt = new NoteAdded(0, "someNote") // create some data, in form of an event
                    {
                        SequenceNumber = ++version // protocol way of managing concurrent write to the stream
                    };
                    var events = new List<NoteAdded> { evt };
                    var data = events.Select(e => new EventData(
                        e.AsBytes(),
                        Guid.NewGuid(),
                        Guid.NewGuid(),
                        e.GetType().AssemblyQualifiedName,
                        e.Id,
                        e.GetType().Name,
                        e.SequenceNumber,
                        e.TimeStamp))
                    .ToList(); // protocol way of how to serialize and package the event data

                    var batch = new EventBatch(streamKey, Guid.NewGuid(), data); // another protocol way of packaging the data

                    await db.StoreBatchAsync(dbId, batch); // store the data to the db
                    
                    Debug.WriteLine(version); // so we expect to reach ~22-30 entries before sudden crash. Sometimes more, sometimes less.
                    await Task.Delay(1000);
                }
                catch (Exception ex)
                { } // you can put breakpoint here, however, the big problem (and mystery) is that these do not catch anything, program just dies OR a NullReferenceException is reported in logs; "occurred in Unknown Module".
            }
        }
        catch (Exception ex)
        { } // you can put breakpoint here, however, the big problem (and mystery) is that these do not catch anything, program just dies OR a NullReferenceException is reported in logs; "occurred in Unknown Module".
    }

And also, I pushed the changes to the repo.

Hey @oetyng, I can confirm I can run my soak test with my local network successfully up to 1000 iterations, at that point it fails because I’m reaching the app’s own container limit on the number of entries as expected, i.e. 1000 entries inserted in it: -108: Core error: Routing client error -> Exceeded a limit on a number of entries.

I’ll take a look at the other steps you are talking about ImmutableData interactions and add them to my test as well. I’ll get back when I update my branch.

1 Like